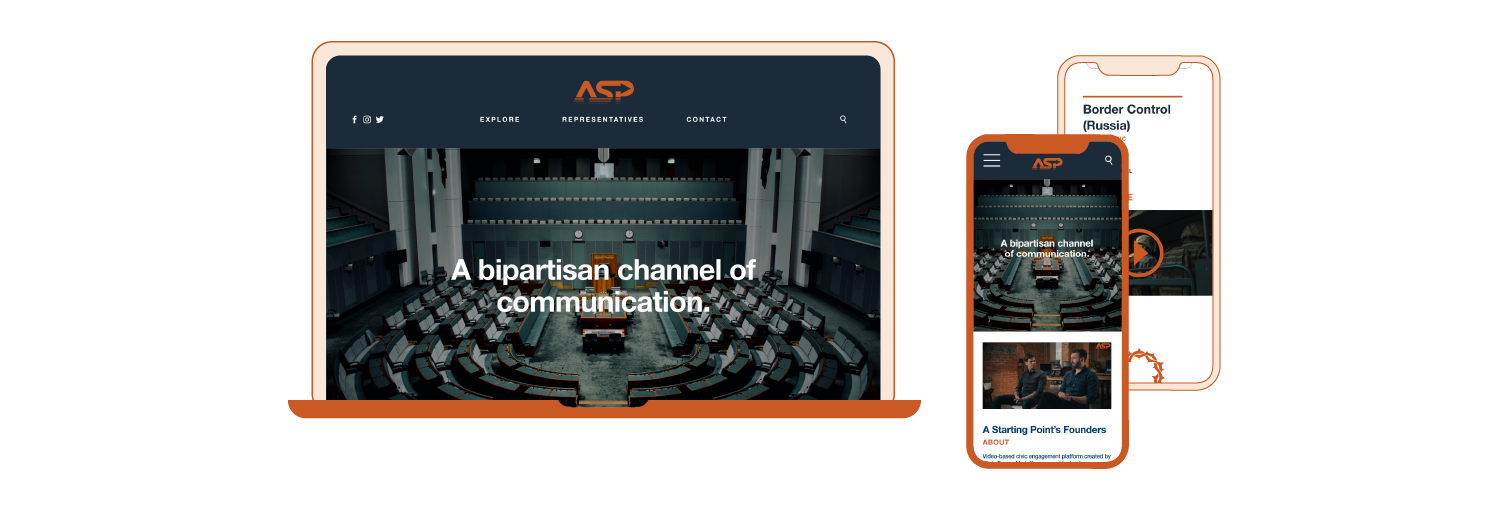
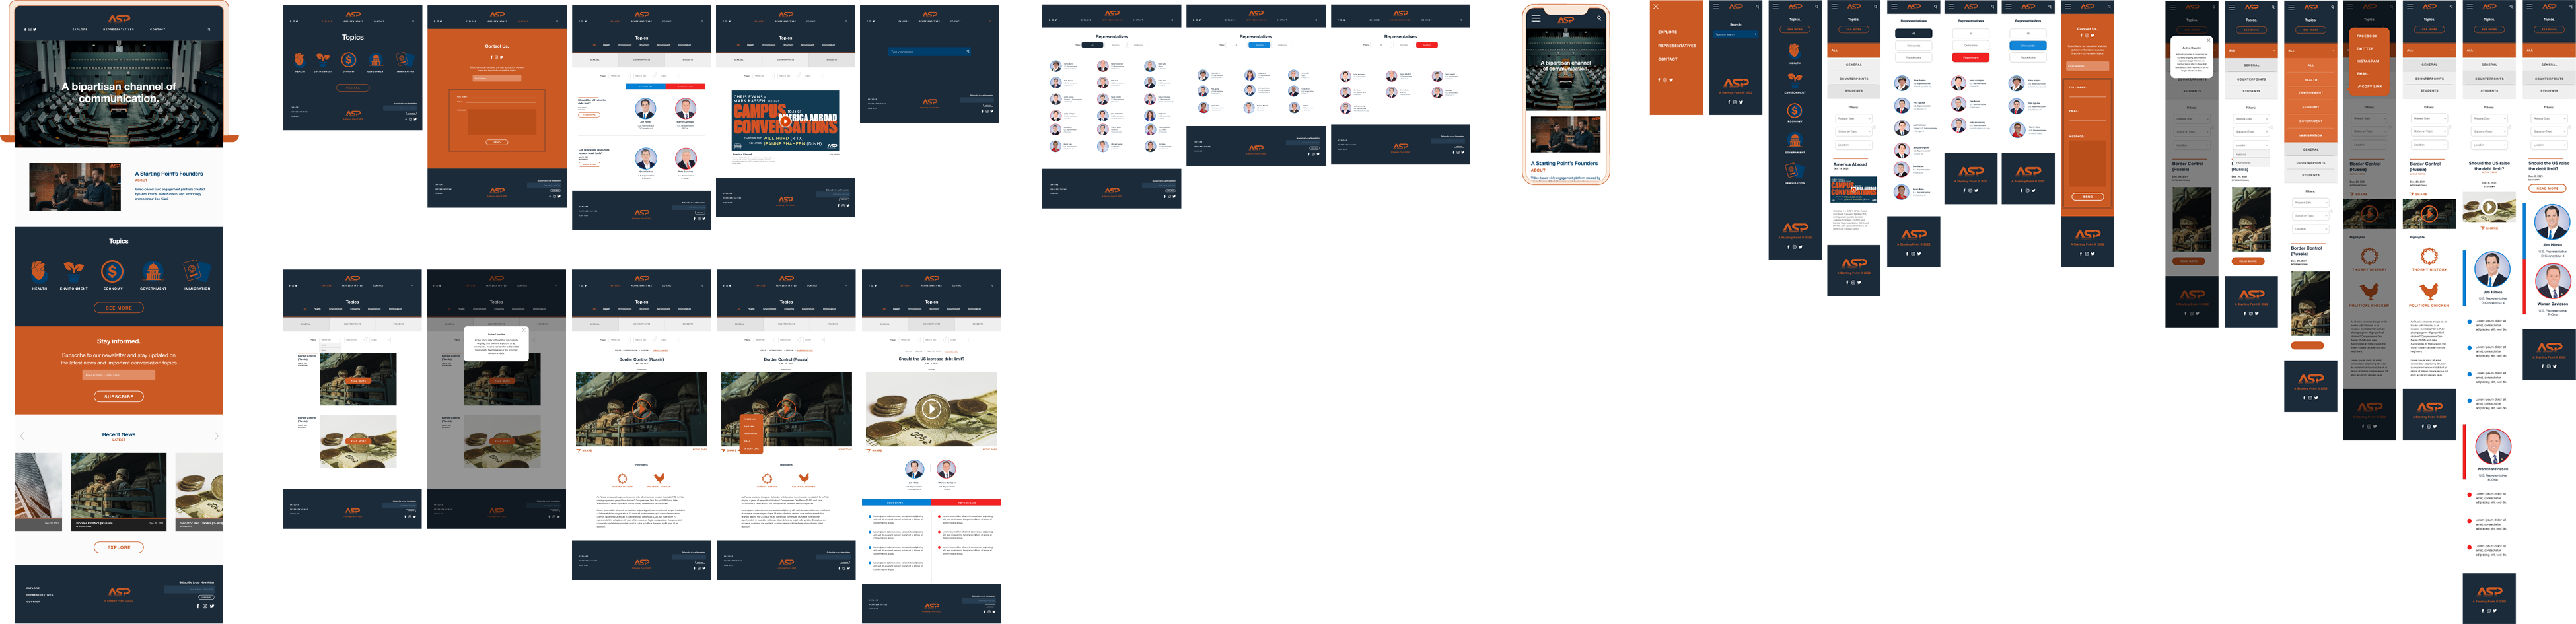
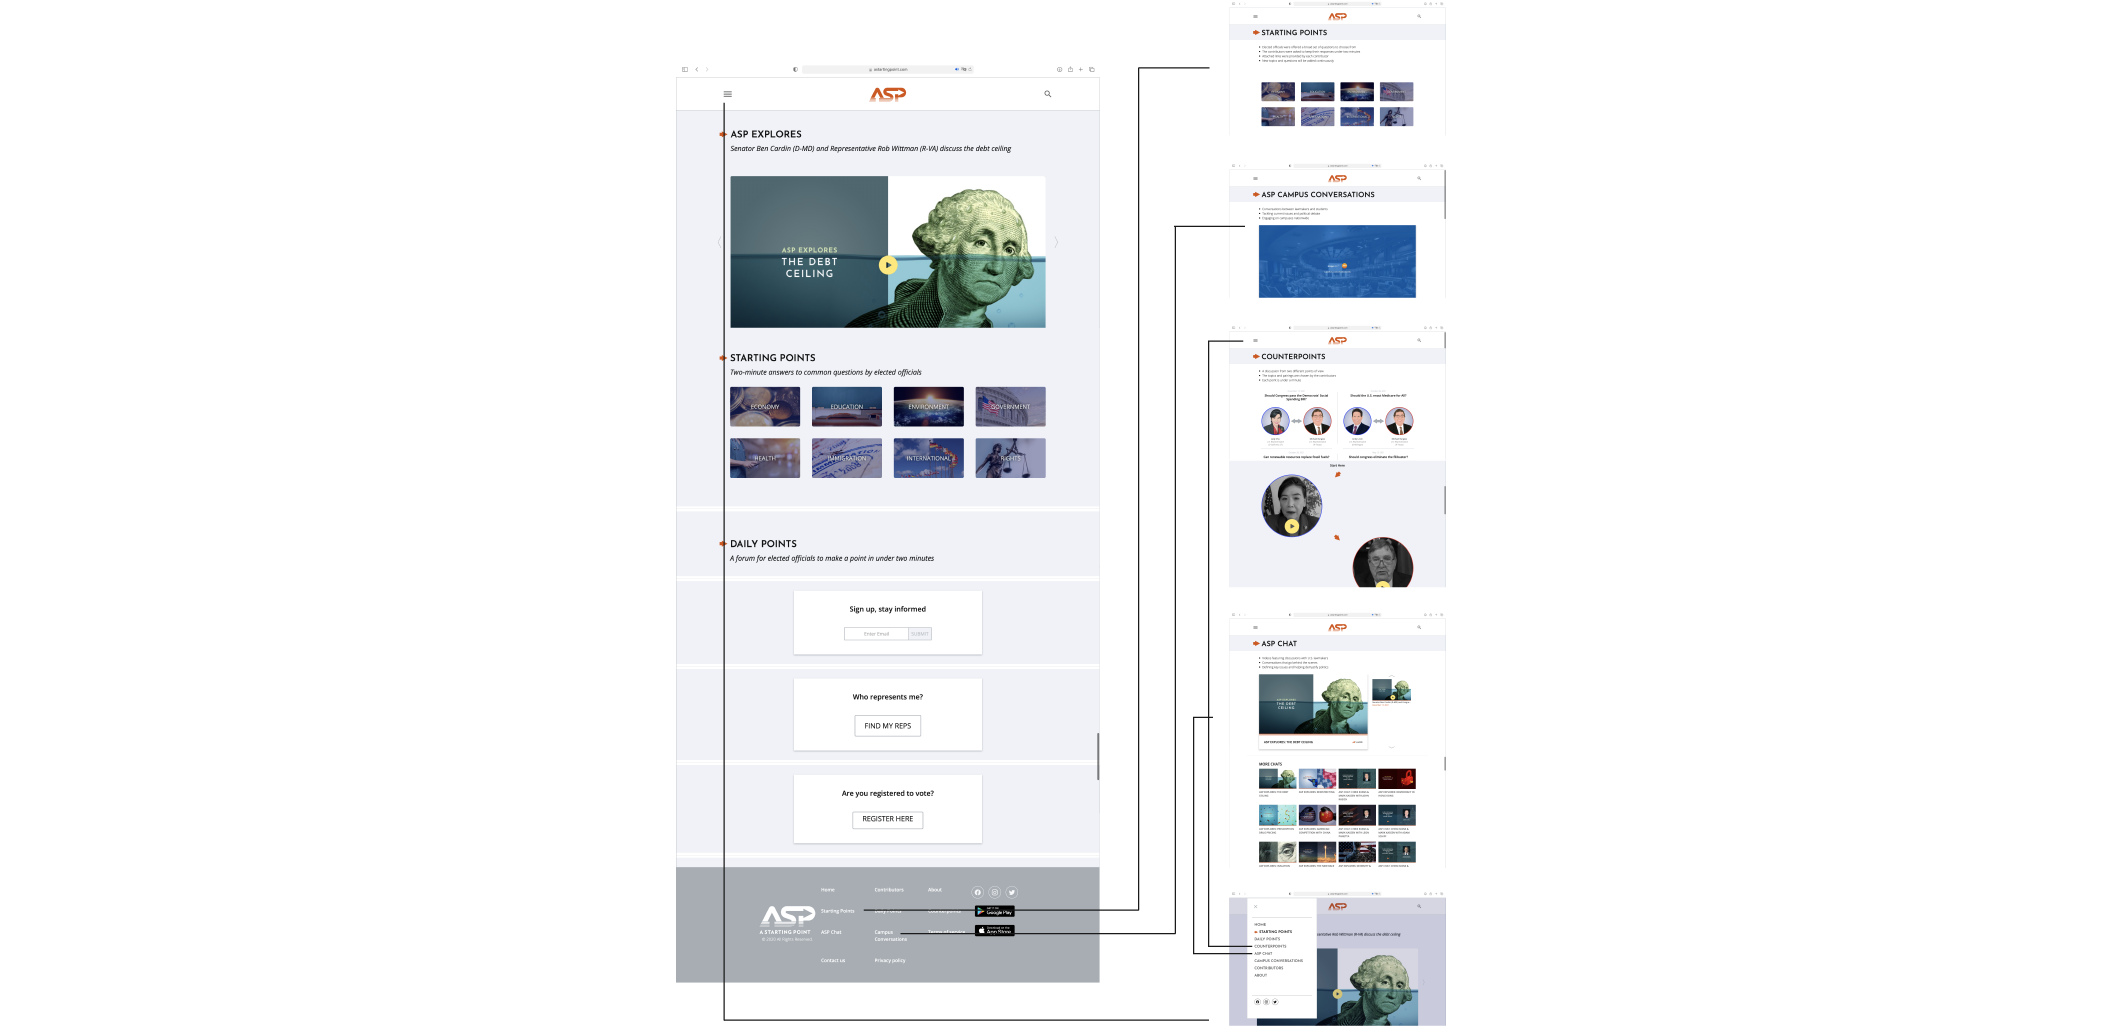
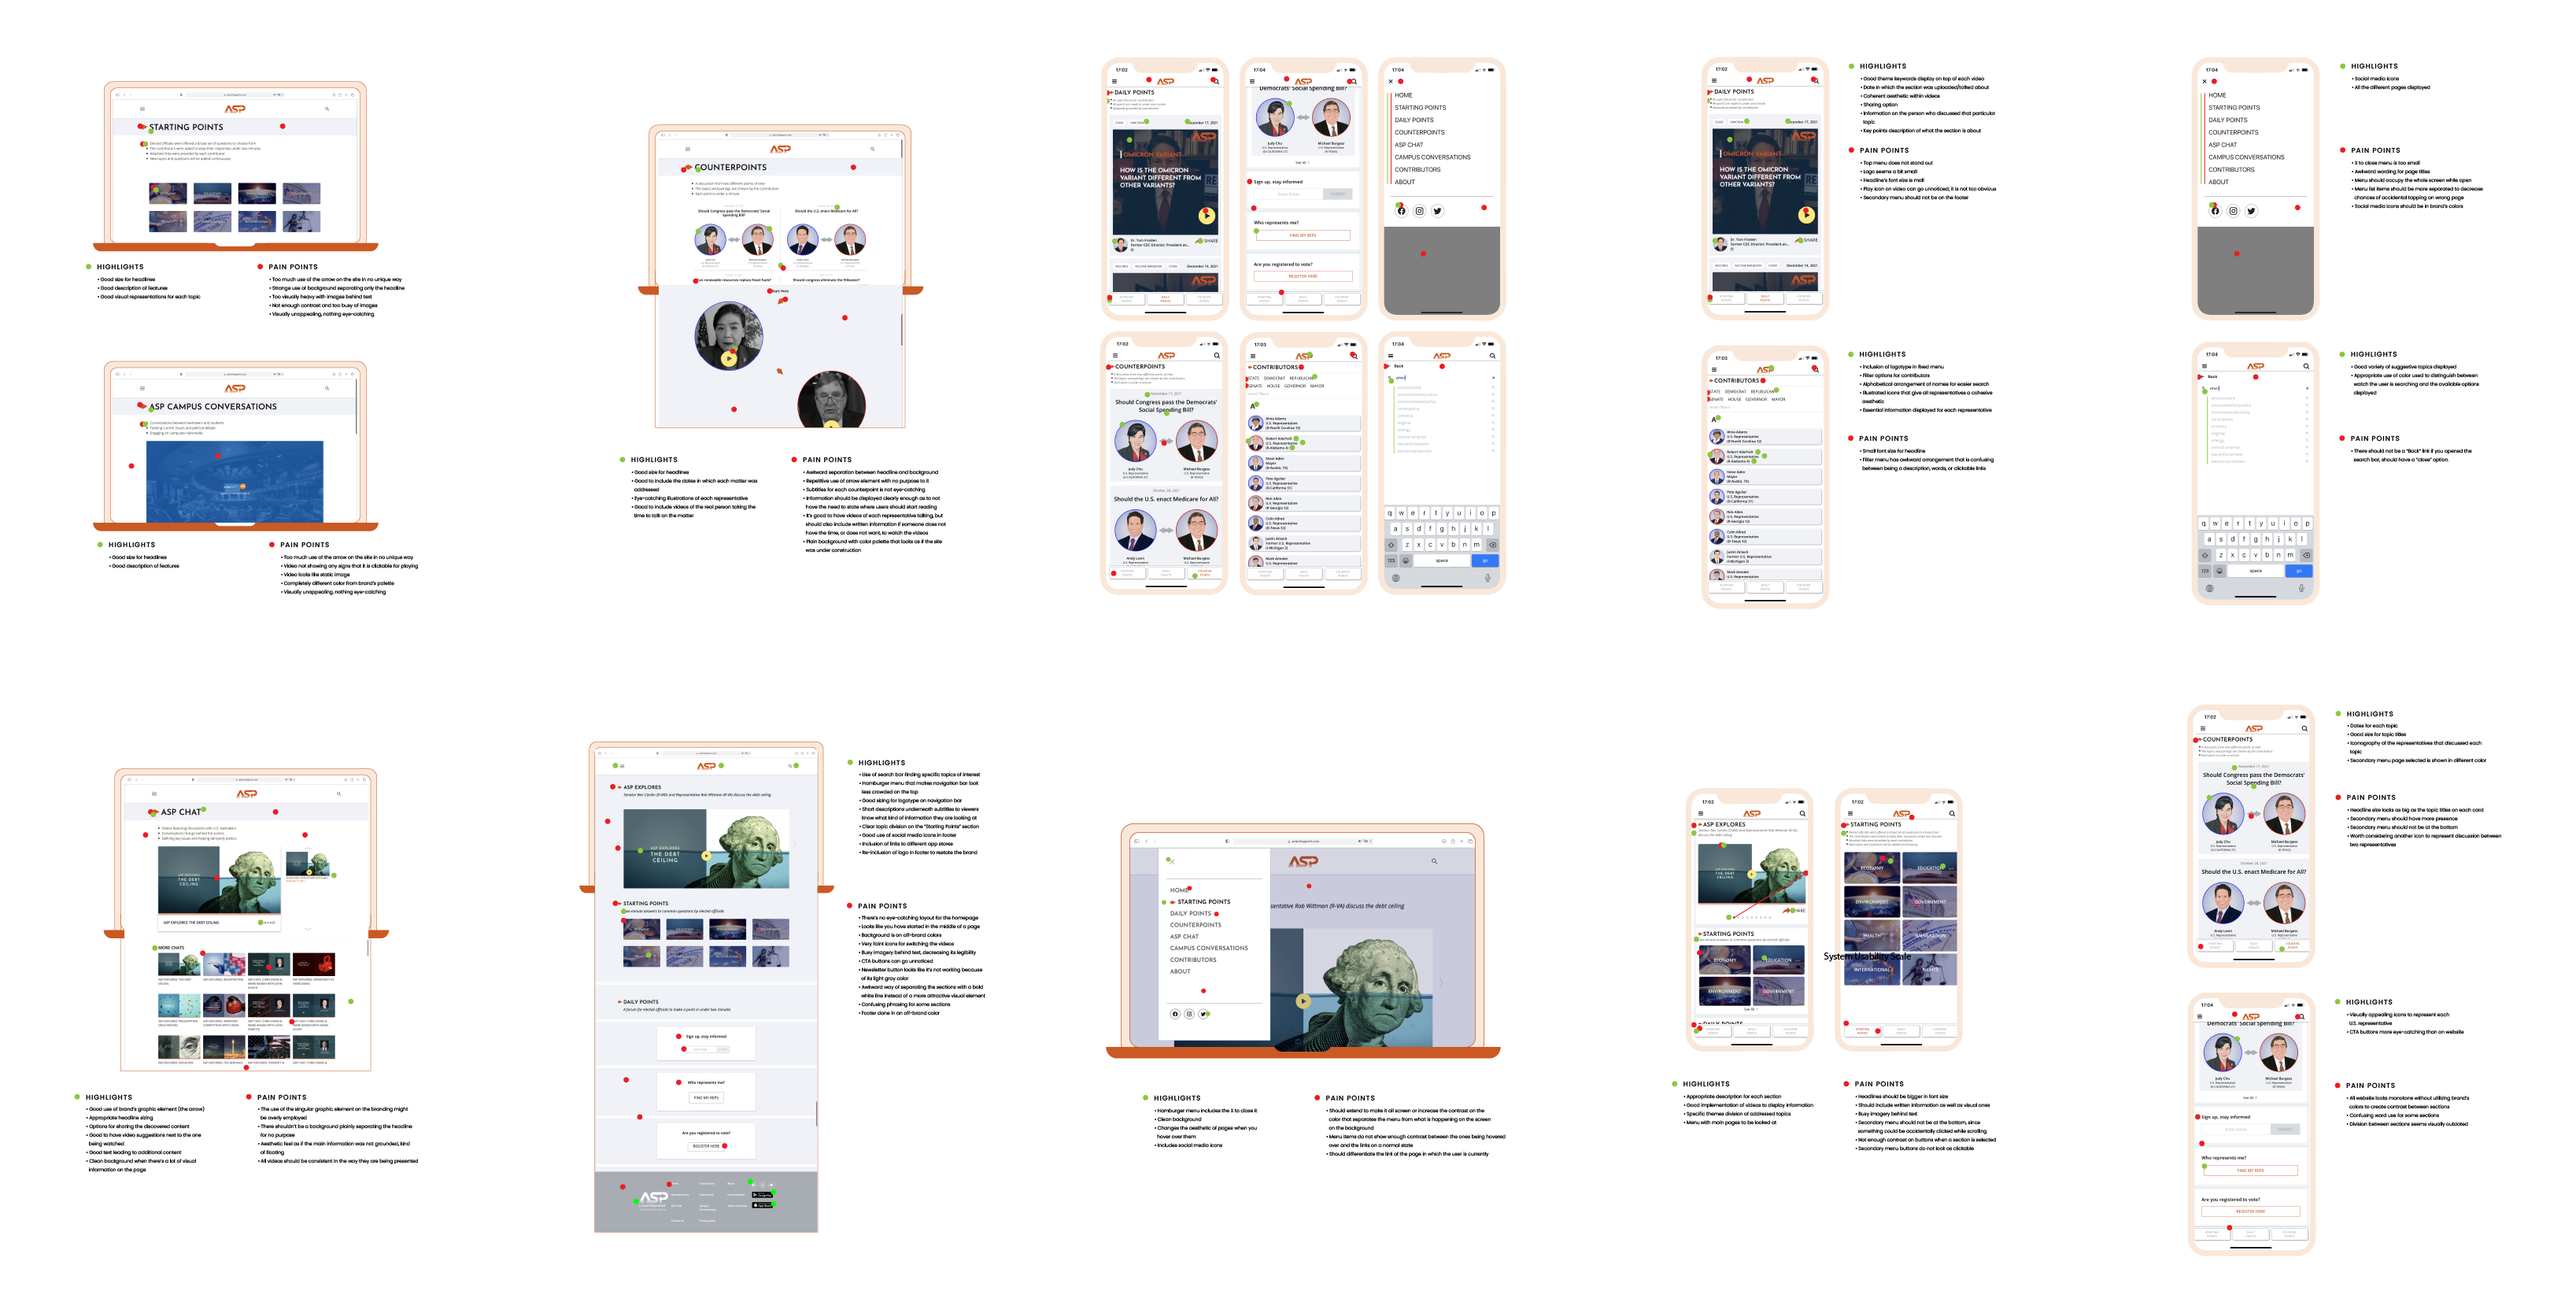
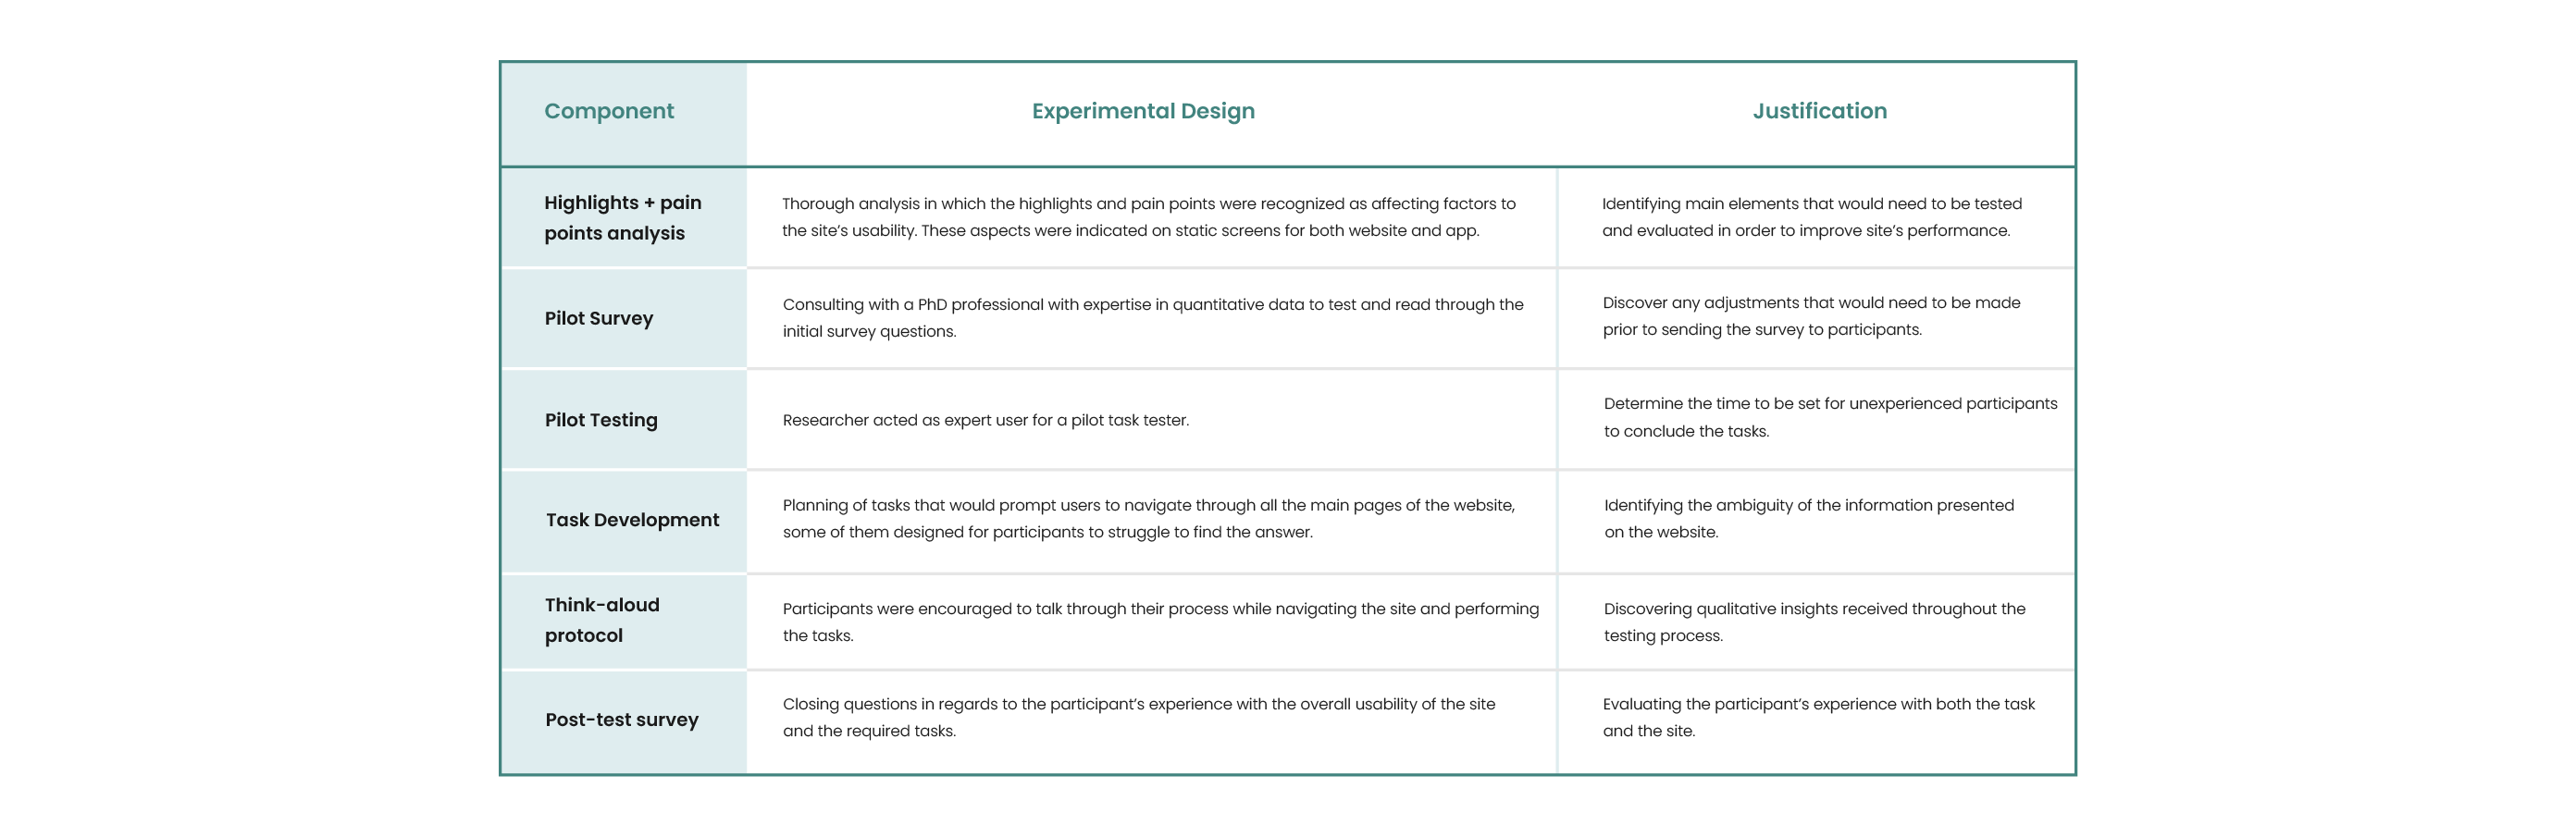
The website for “A Starting Point” is sober both visually and in content. It contains a condensed display of the information, automatically making the content not overwhelming for users. Besides the links found on the navigation menu, there are no other buttons or direct links throughout any subpage that would connect you to other subpages. As part of the background research for the chosen site, it was decided to perform an analytical dissection of several screens of their website and app, identifying the site’s highlights and pain points. This action was performed with the purpose of discovering, determining, and evaluating the different moments in which the site works without a logical layout and against the user’s instincts.
• Can every-day users find pragmatic explanations of very technical topics regarding economical, political, and social issues?
• How digestible is the information currently presented?
• Does the user feel sufficiently prepared to discuss any of the covered topics with the amount of information that was covered?
This testing study follows the Common Industry Format (CIF). Data was gathered from preliminary surveys, user-defined task goals with the thinking-aloud protocol, and post-test surveys. All interactions took place in controlled environments and with controlled conditions, ensuring the user’s comfort and attention on the requested tasks
For this particular study it was decided to follow a one-shot type test. Acknowledging the established research questions, there are two main quality criteria to be taken into consideration while performing the tests: trustworthiness (given the fact that it is an online site) and engagement (for the amount of information that is being conveyed).
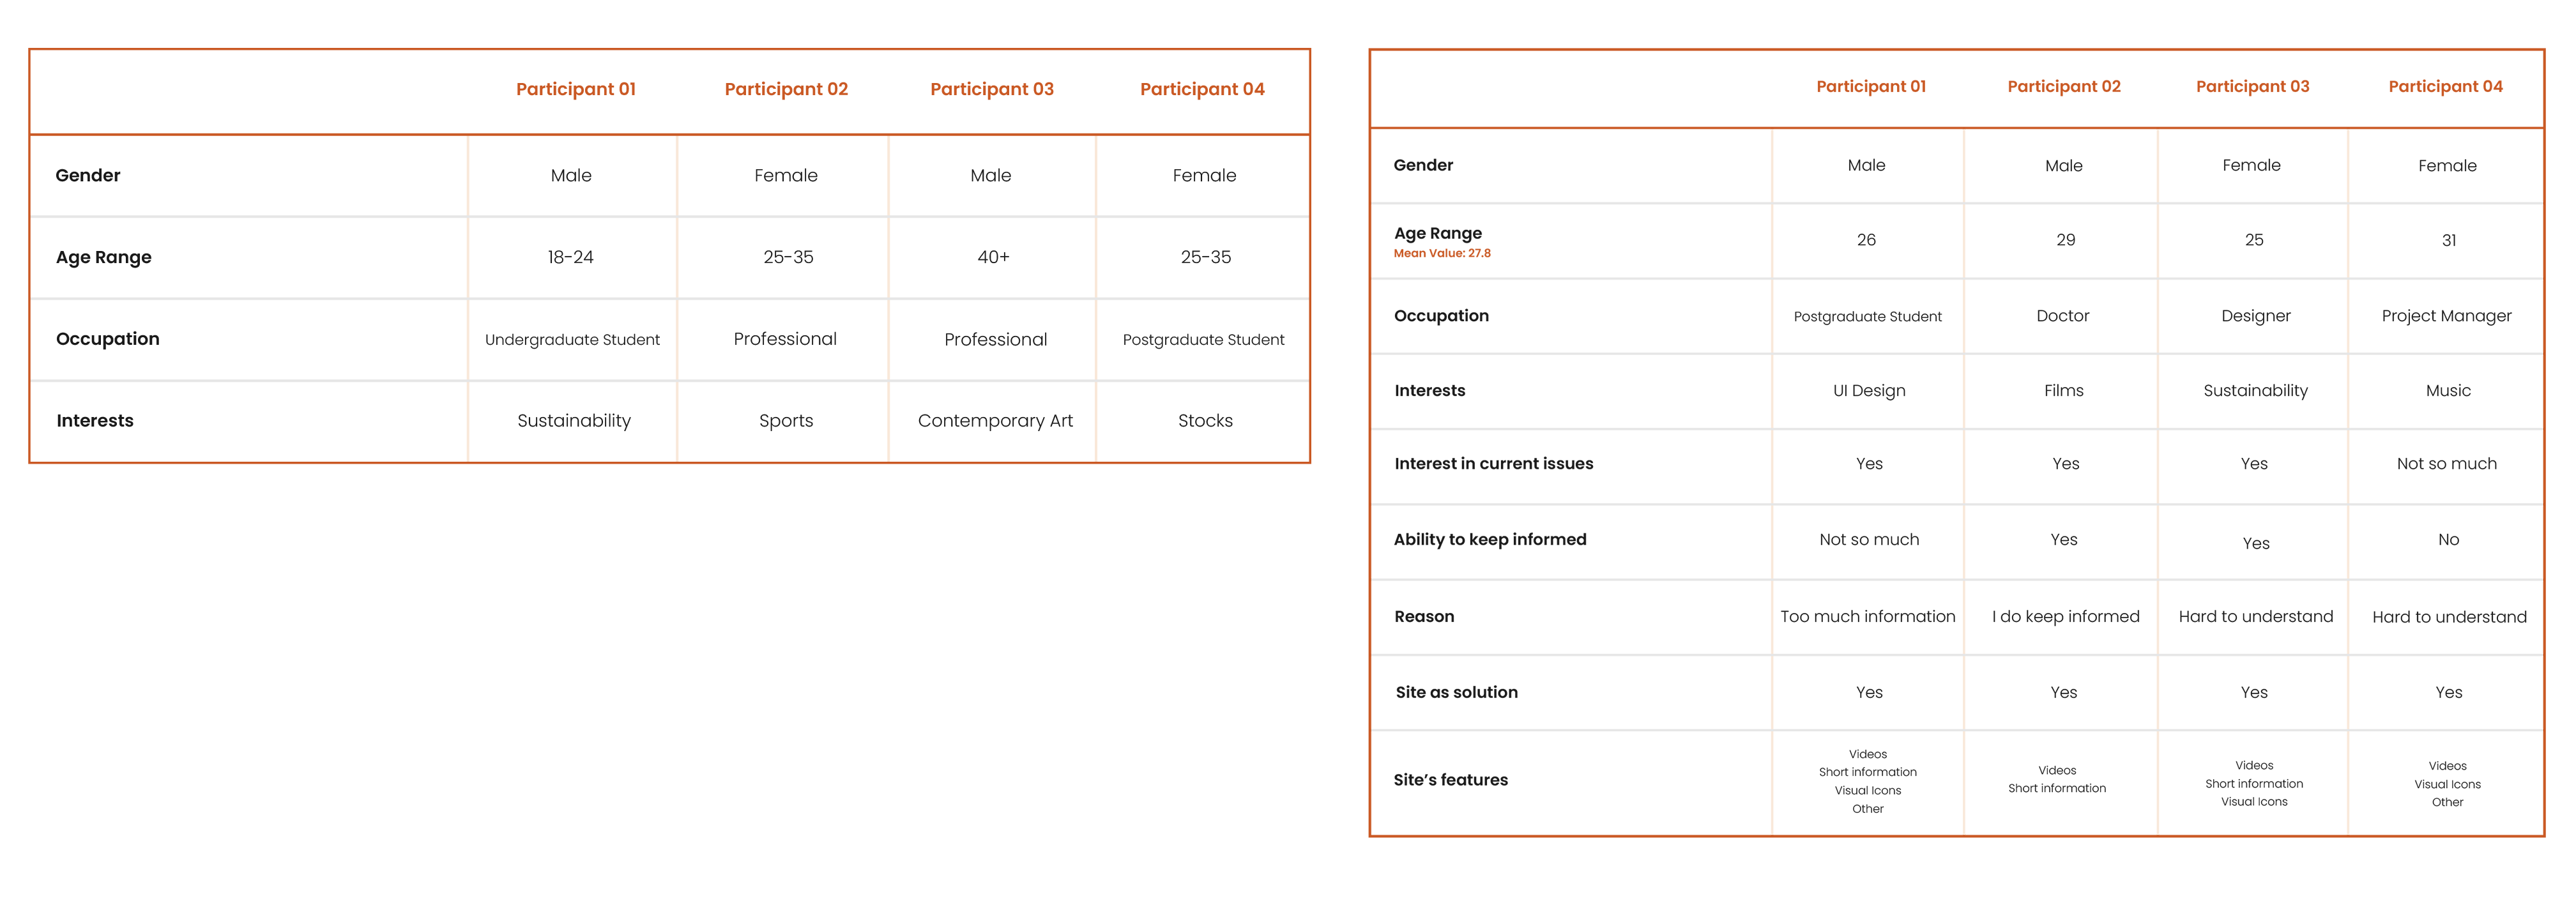
This chart was created to contemplate different plausible scenarios and backgrounds for the participants, allowing for a wider niche of user sampling. The survey questions and task actions were also categorized into continuous and discrete variables in order to produce a clearer analysis on the gathered information. Furthermore, the questions for the initial survey covered three types of information.
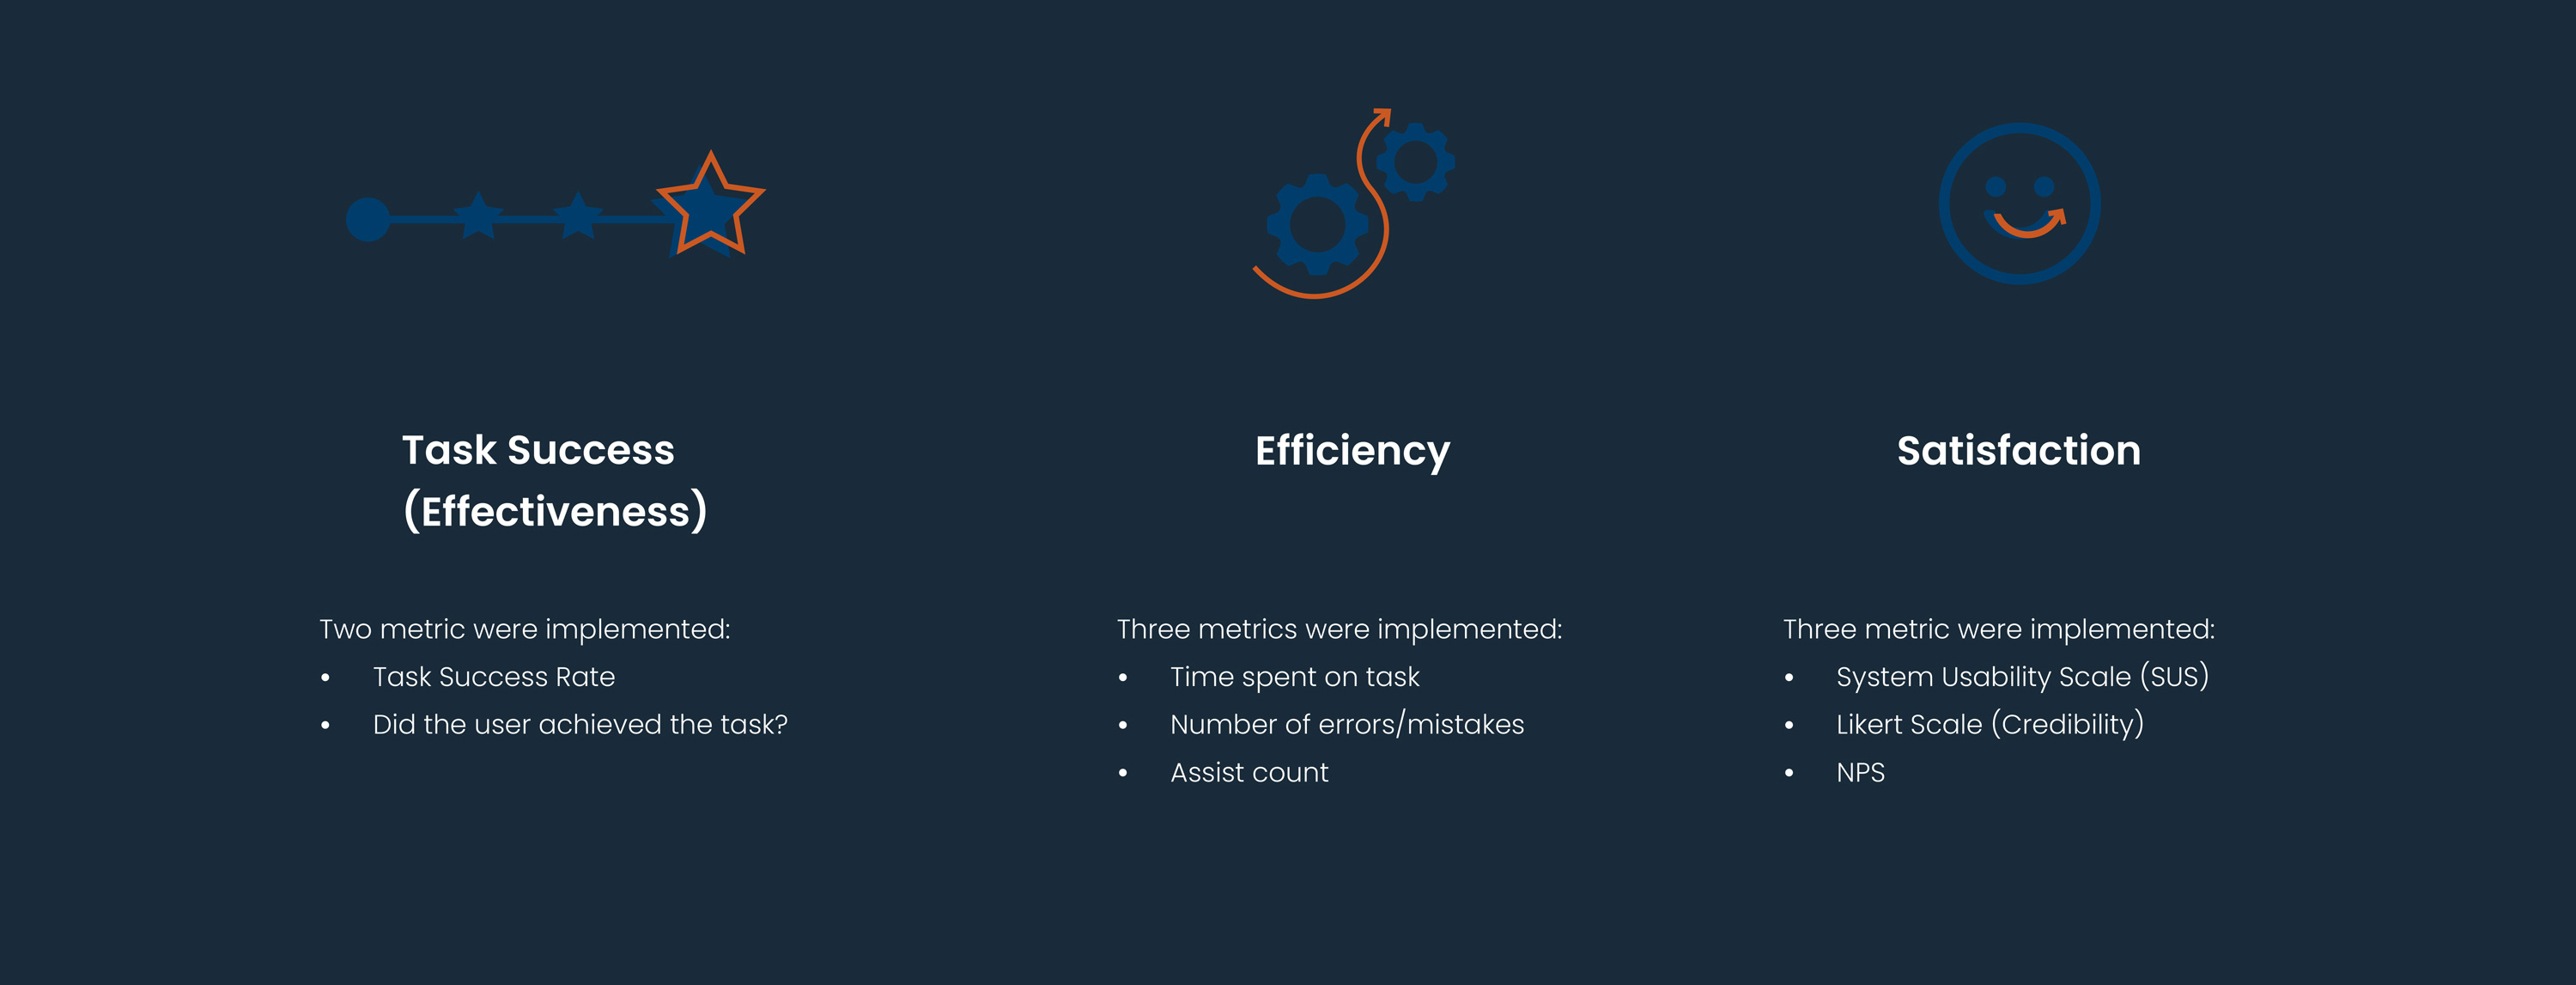
Continuous variables: time on task, amount of errors, number of assists, rating scales
Discrete variables: task success, yes/no/not so much questions, preference listing.
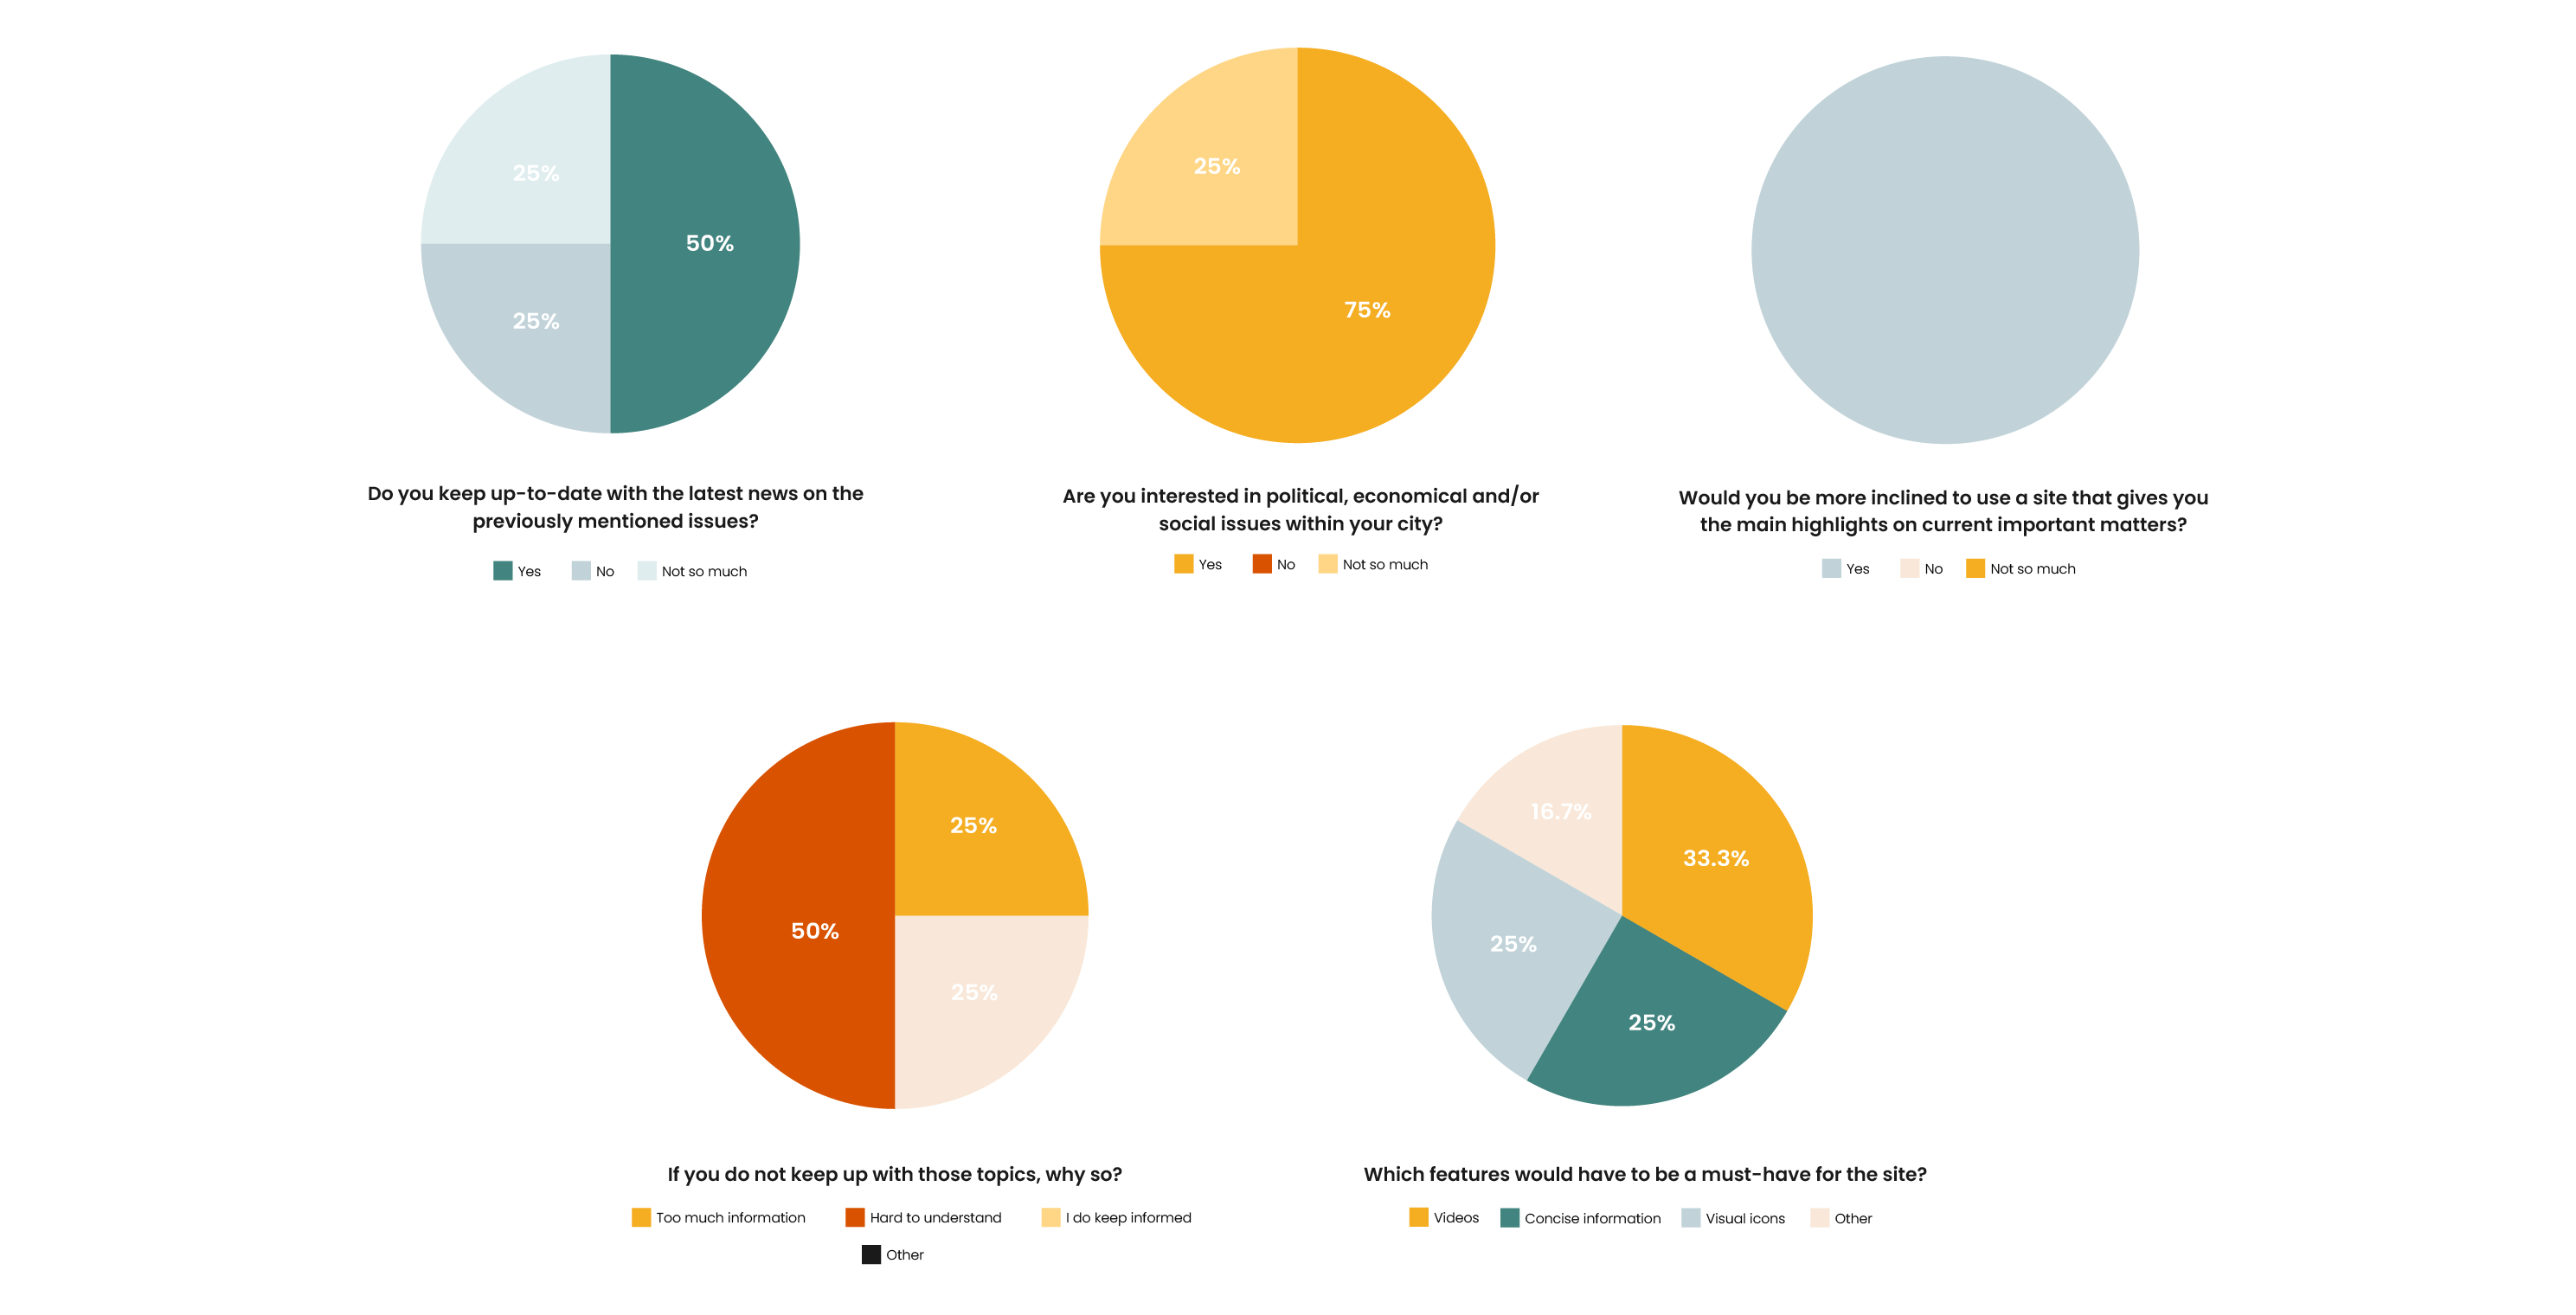
Q1-3: Background information
Q4-6: Topic awareness and involvement
Q7-8: Site build-up inquiries
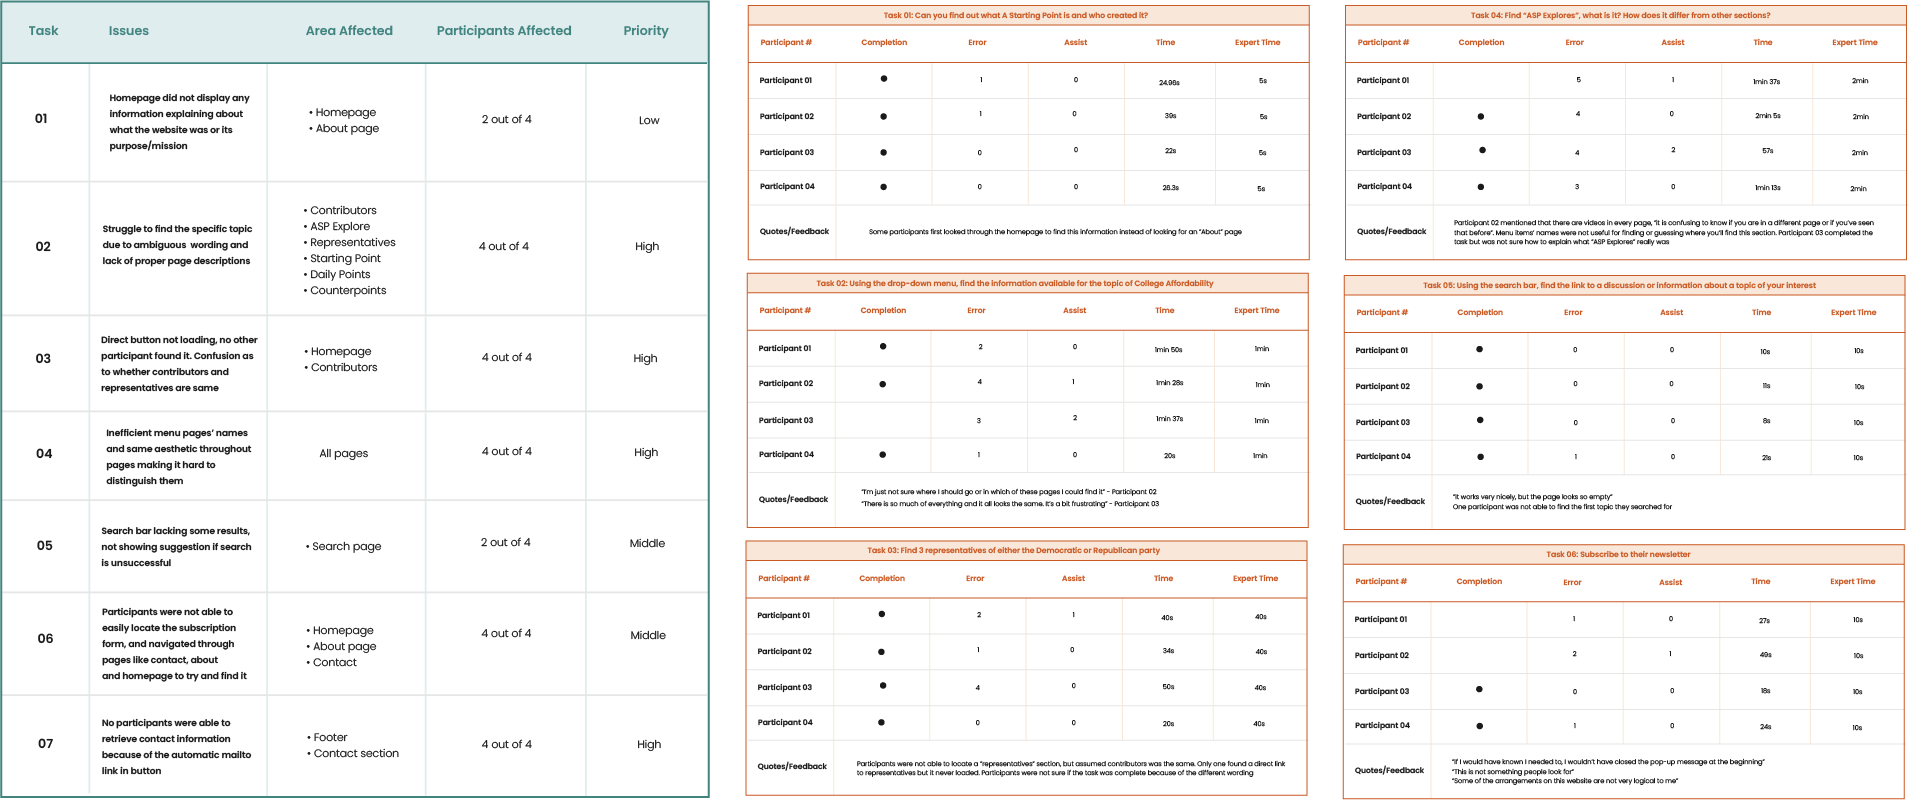
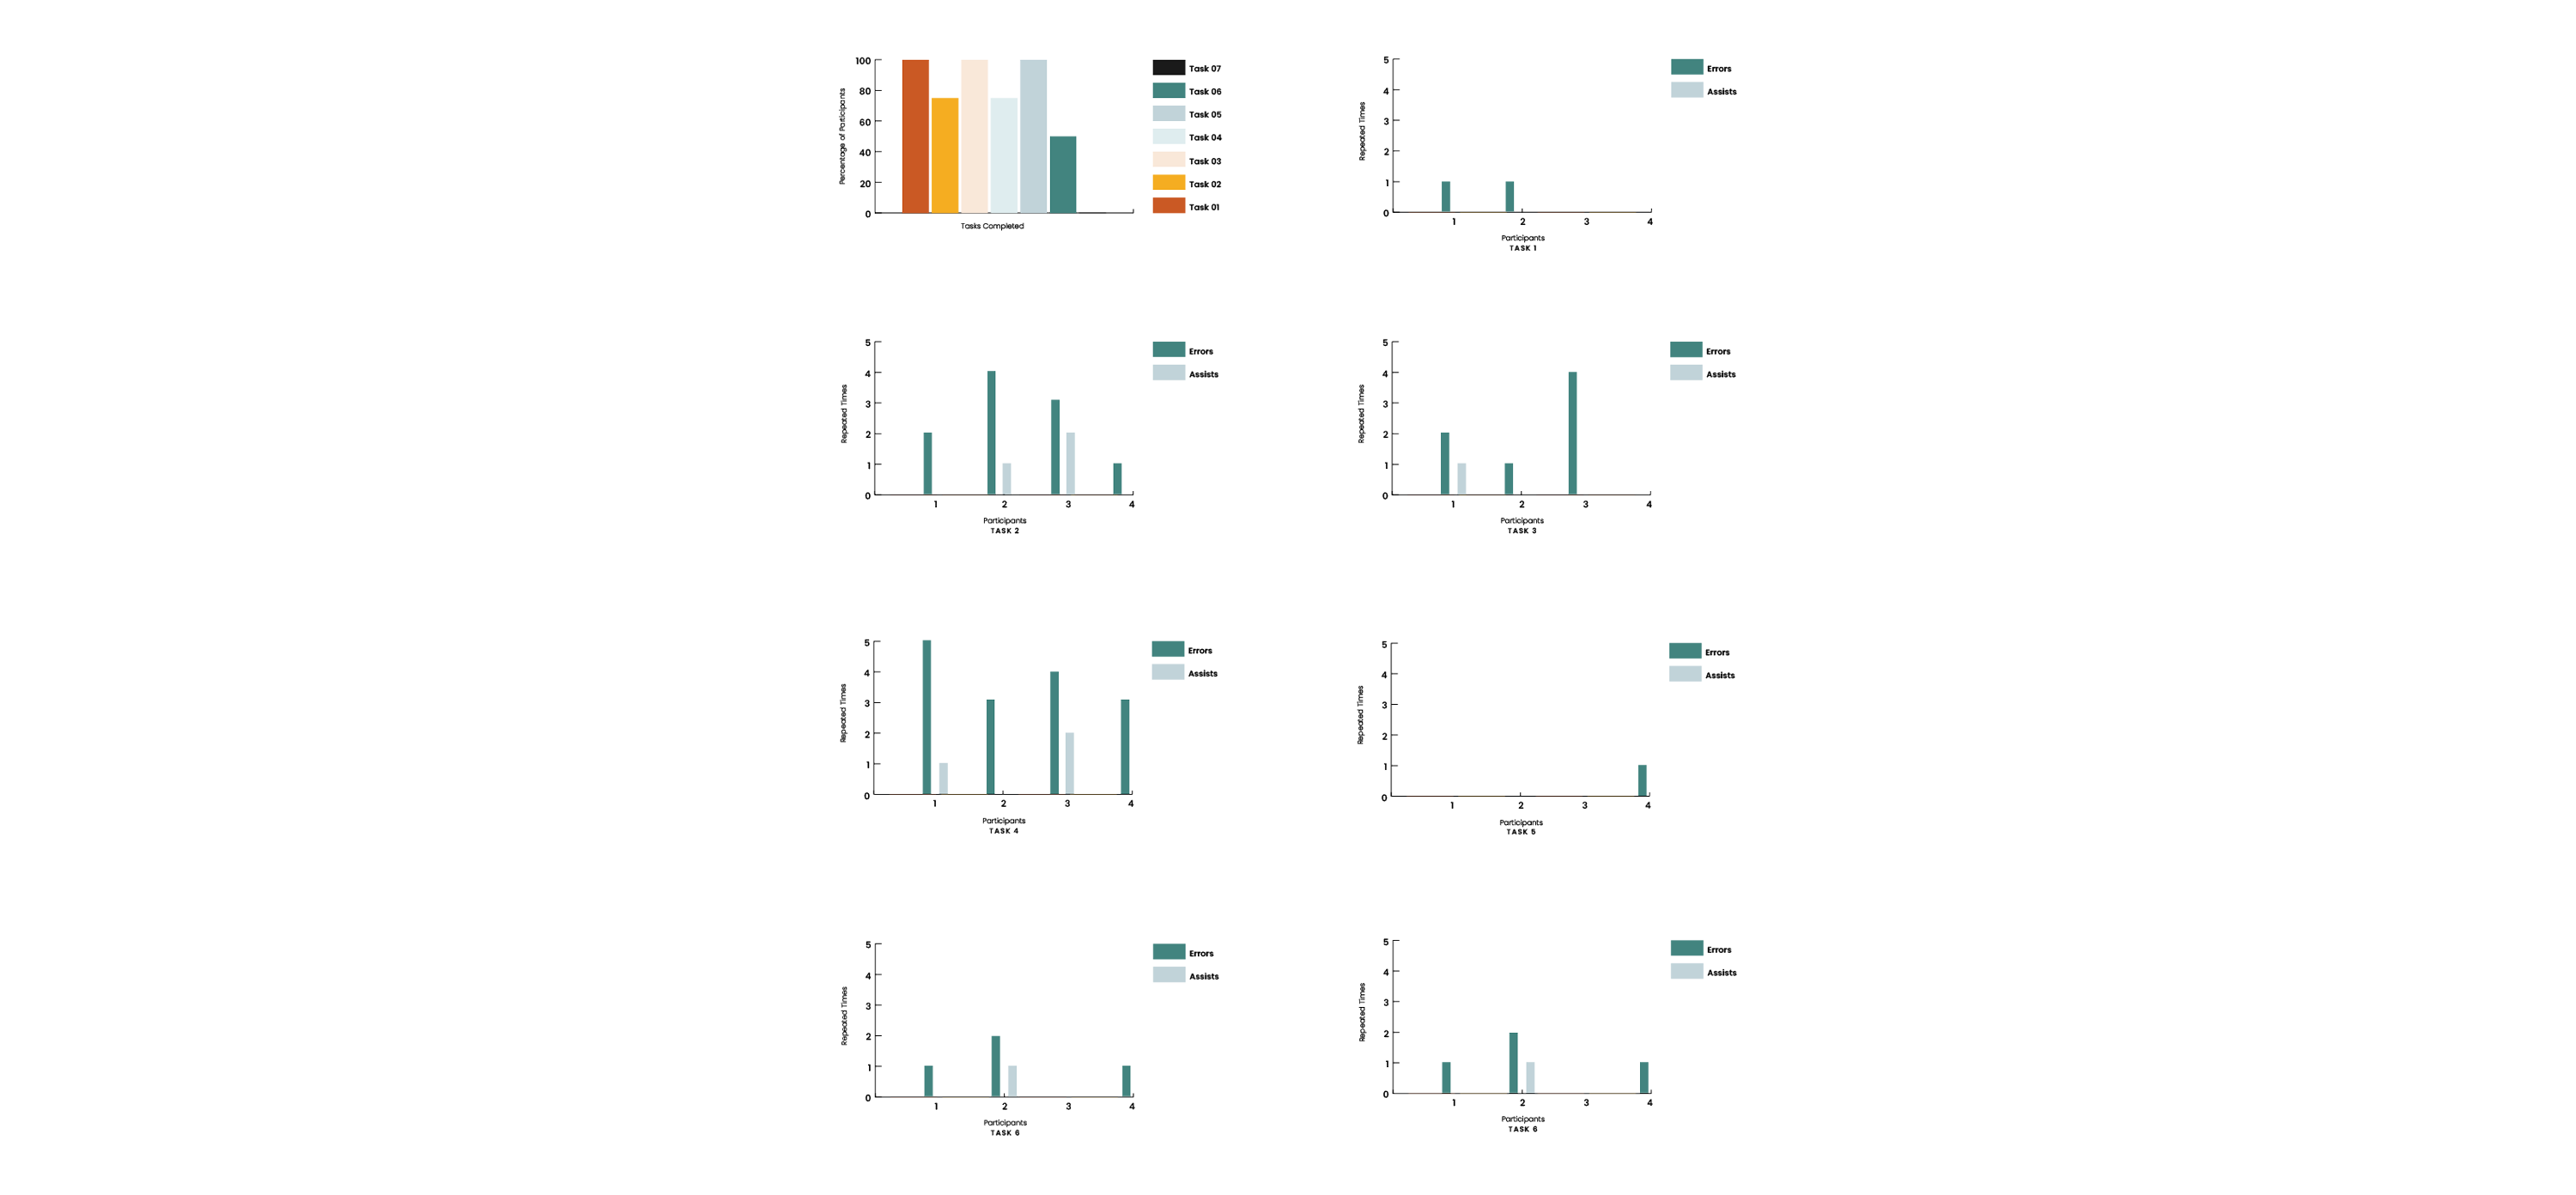
Findings show that 42.8% of the tasks were completed successfully by all participants, 28.6% of the tasks were only completed by 3 participants, 14.3% was only completed by 2 participants, and none were able to accomplish Task 07. Taking these findings into consideration, it would be a valid usability conclusion to state that the tasks that were broader in nature, allowing the user to explore the site, were more feasible to achieve rather than the ones that asked users to find a specific string of information from the site.
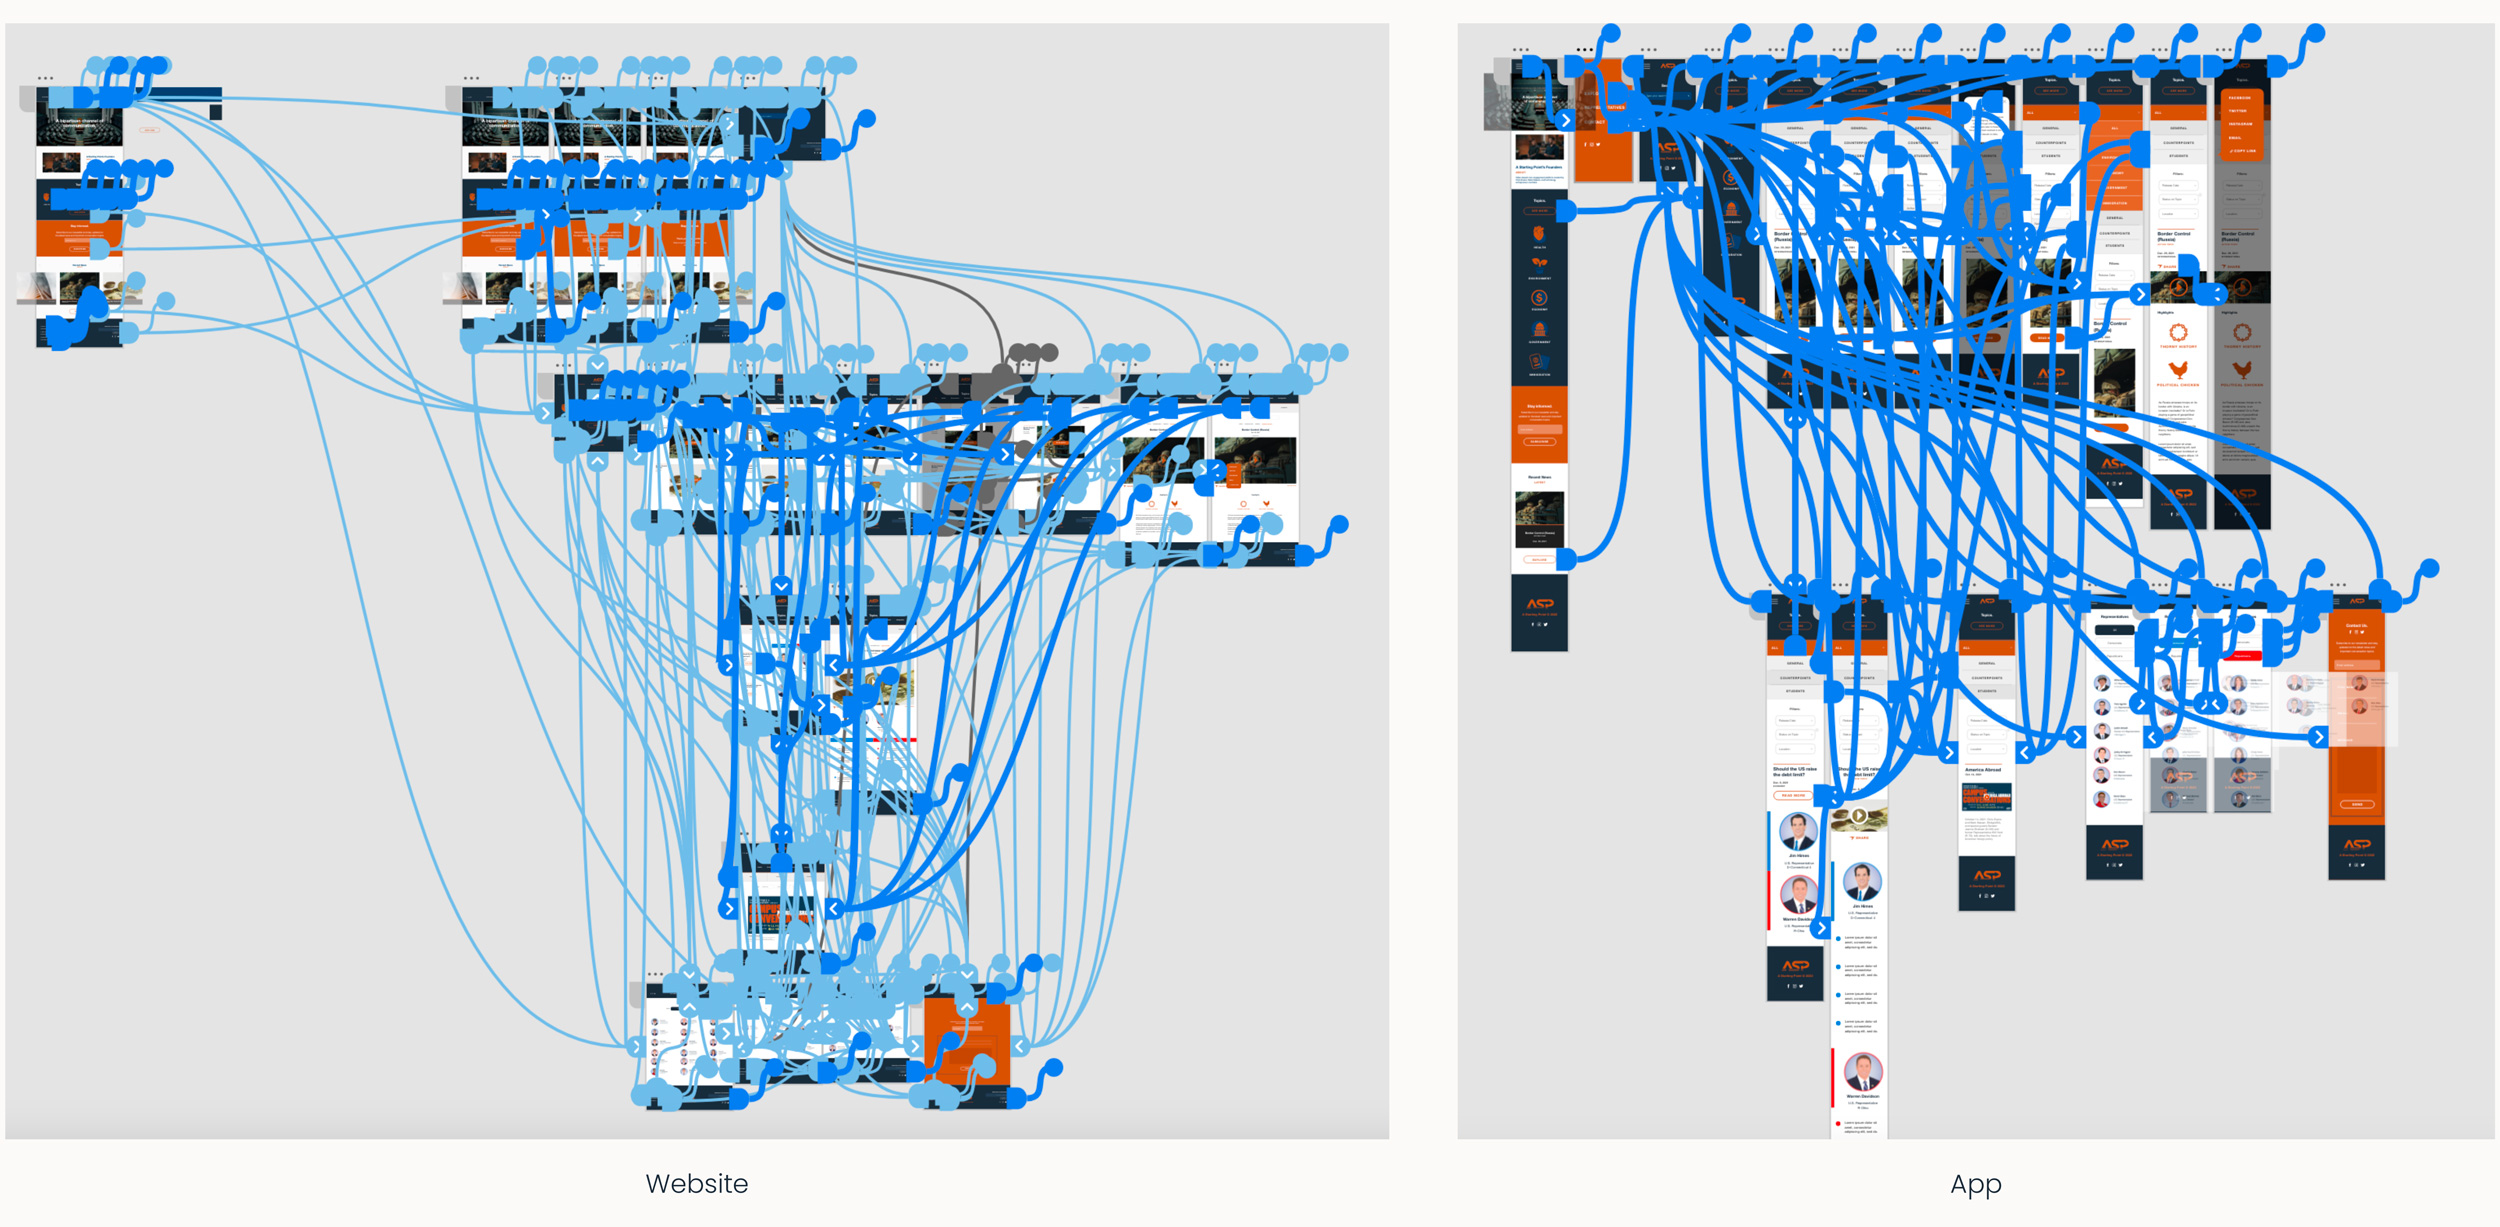
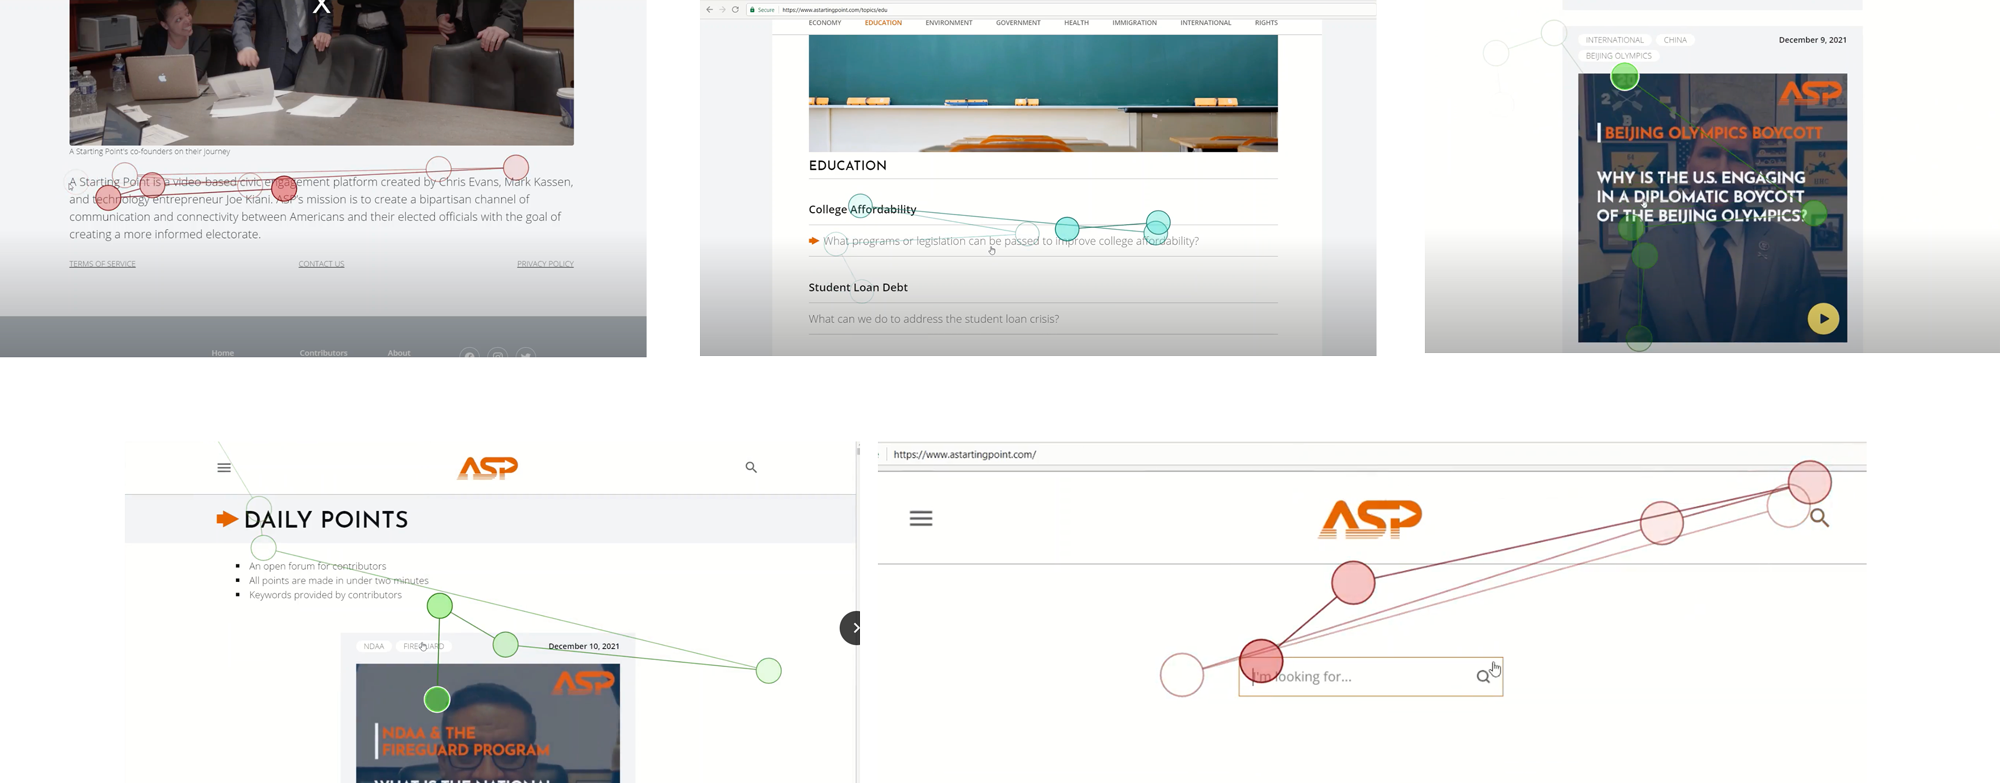
Eye gaze data visualization provided by Tobii Pro allowed for precise insights and subconscious feedback in the way in which users navigate through a site. Where do their eyes focus on? Do they read or scan? Do their eyes go to the visuals or to high-hierarchy text? Which elements go unnoticed?

Prior to proceeding with the hierarchical task analysis and based on the previously performed usability testings, it was decided that more than one task needed to be redesigned in order to bring the site’s mission to life.
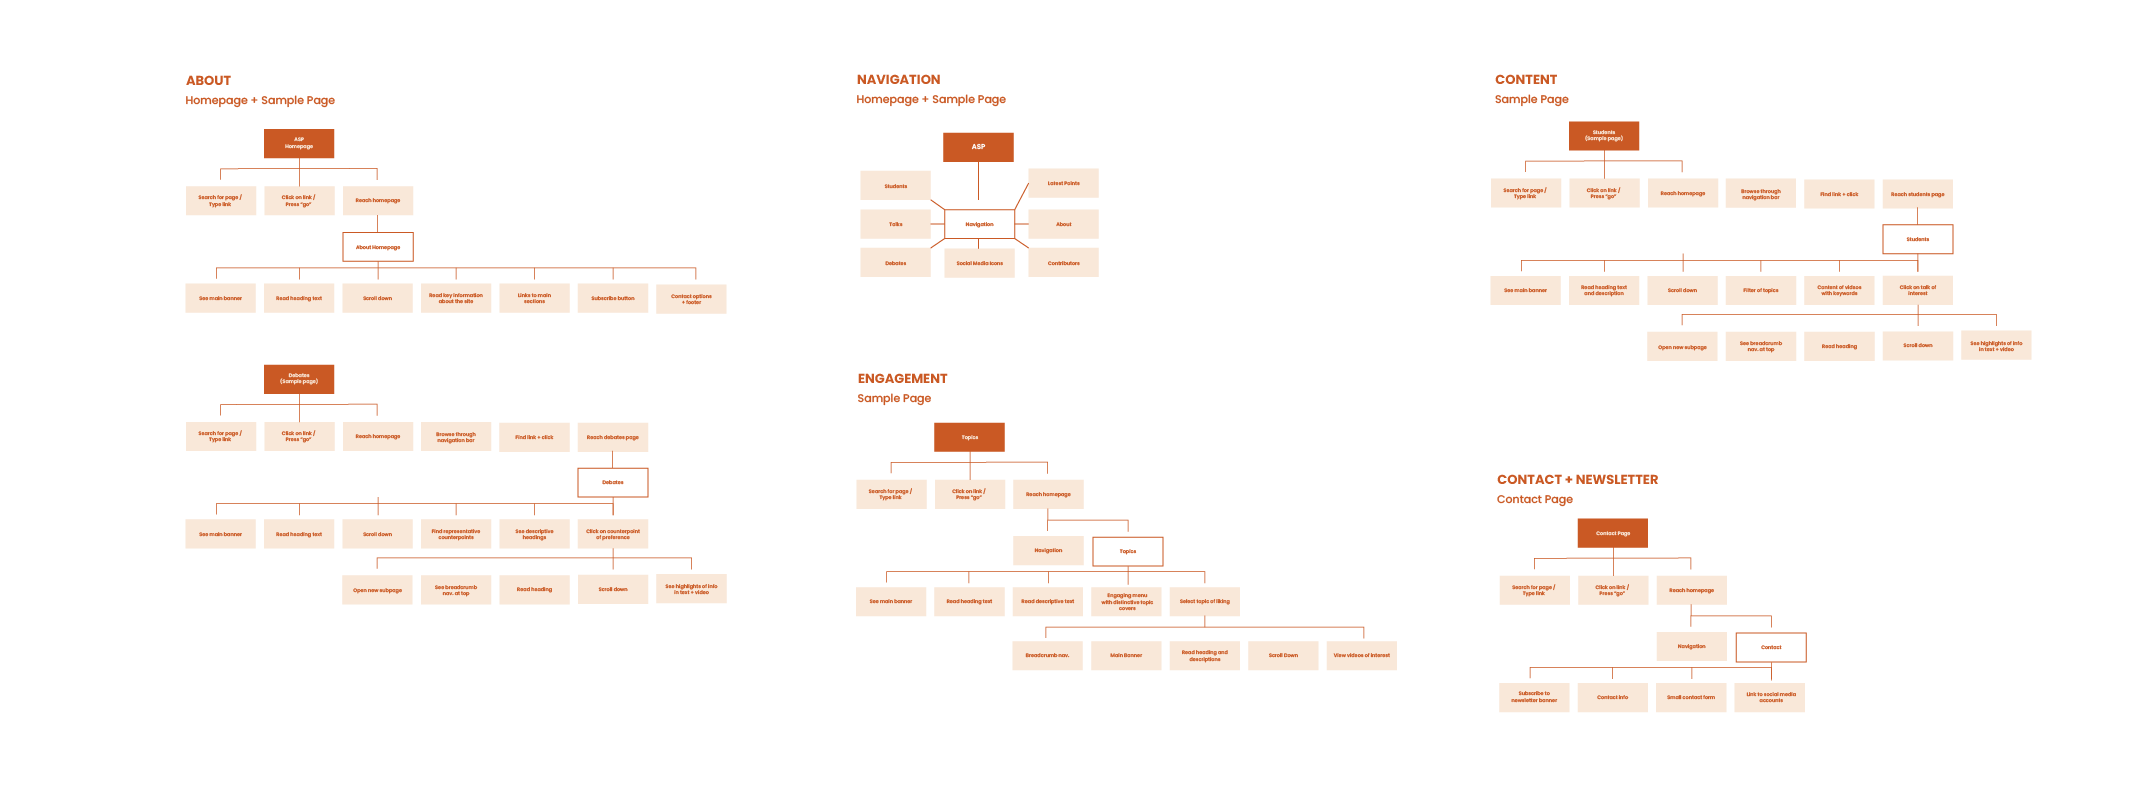
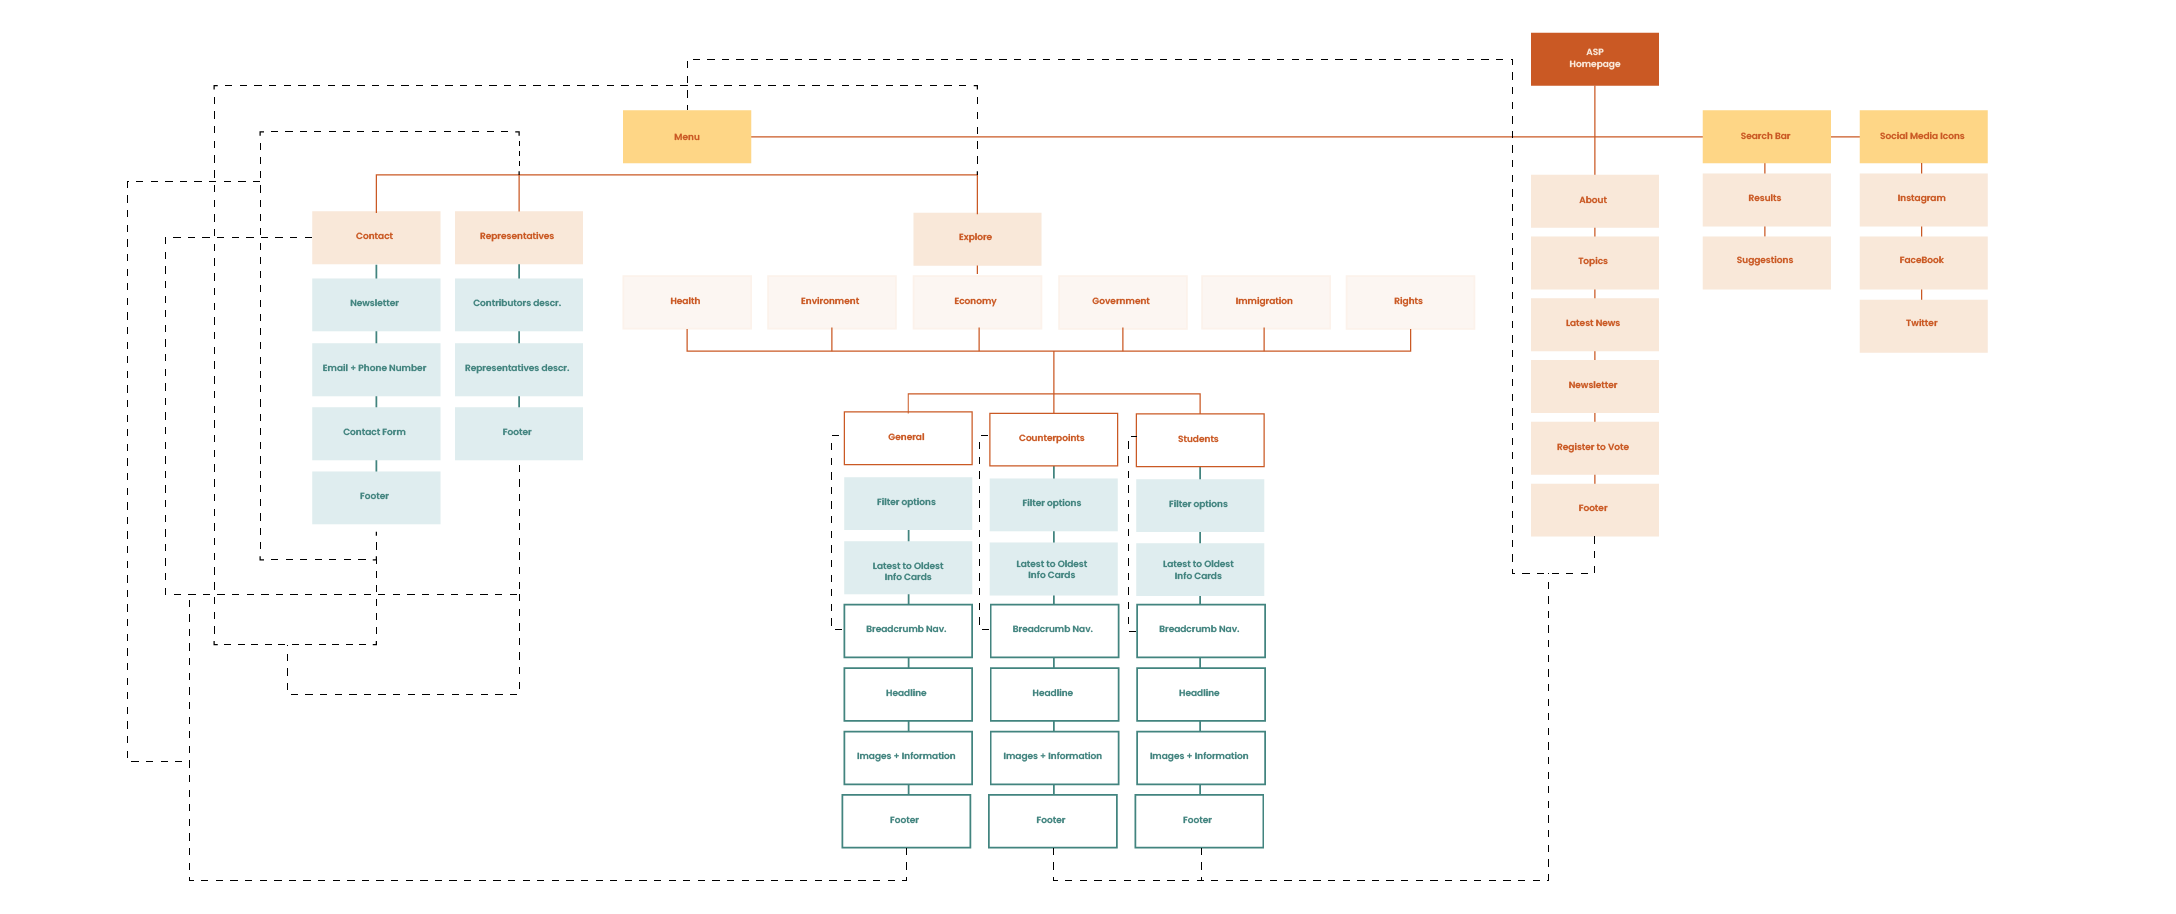
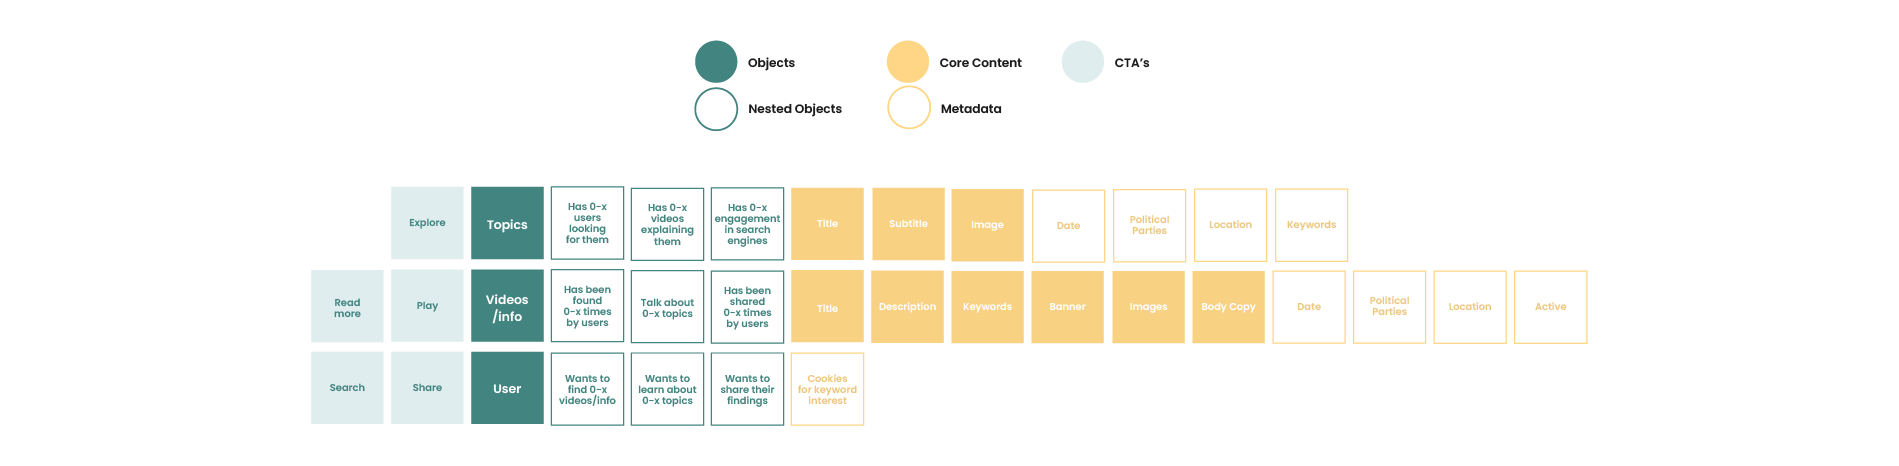
With the purpose of potentially creating a more efficient user experience, the Object Oriented User Experience (OOUX) approach was followed before finalizing the site map of this project. All objects are arranged in columns and they all include nested objects that provide a guide towards the path in which the navigation will be established.
These discoveries lead to the consideration of, not only eliminating the “About” and “Talks” pages from the navigation but, also placing “Students” and “Counterpoints” under the page of “Explore”. This idea is based on trying to keep the information as clean and easy to find as possible. Based on the behavior demonstrated by participants during the card sorting session, users are more likely to want to eliminate unnecessary menu items if they feel the content is redundant.
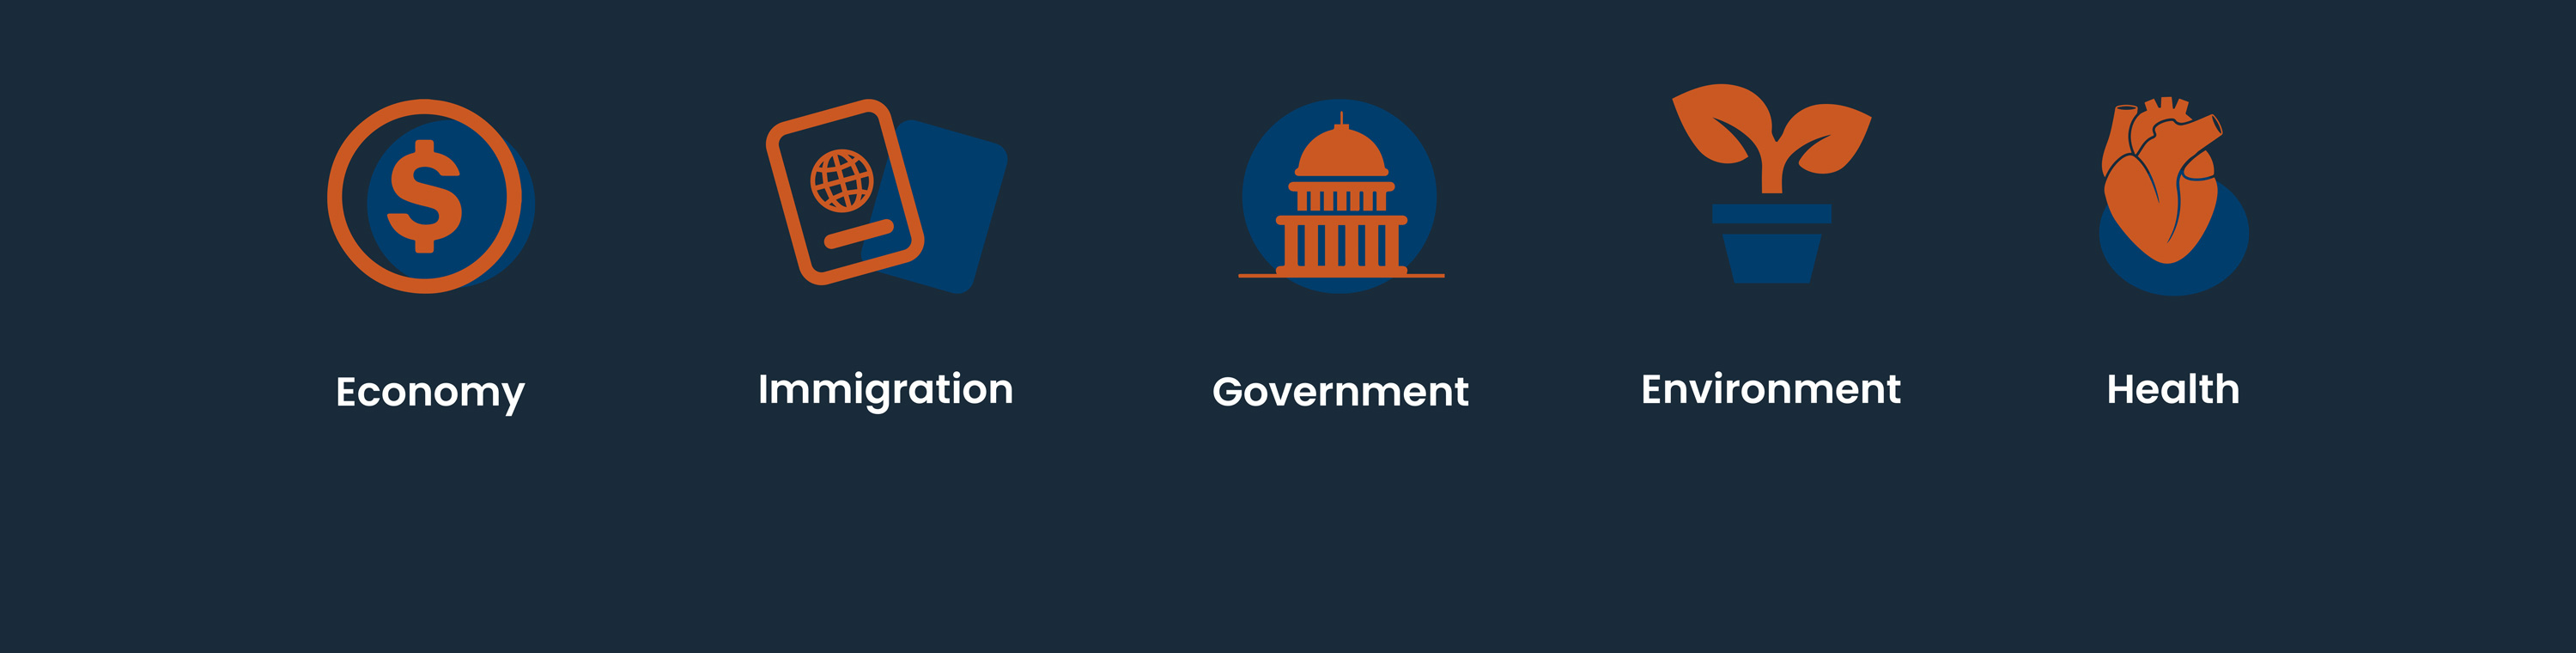
Under “Explore”, users will be able to find all the topics and, after selecting the field they would like to discover, they can choose whether they would like to read general data, counterpoint discussions between political parties, or talks given to students.